Introduction
This document is intended to simplify the work with the NSPIT Viewer and provide an easy start for all users. The NSPIT Viewer is the main component of the National Spatial Planning Information Technology (NSPIT) Platform. This document will explain the various features and functions offered by the NSPIT Viewer. An overview of the Platform’s components is provided in Table 1.
The NSPIT Viewer can be accessed by clicking the following URL: https://nspit.licj.org.jm
Table 1: NSPIT Platform Components
| Component | Description | NSPIT Viewer http://nspit.licj.org.jm |
A web mapping application that lets you access geospatial data for Jamaica. |
|---|---|
| NSPIT Data Portal https://data.nspit.licj.org.jm |
A web portal that lets you access metadata for datasets that are in the NSPIT Viewer. The portal can also be used to download vector data. |
| NSPIT Help Portal https://help.nspit.licj.org.jm |
A web portal that includes help documentation for anything related to the NSPIT Platform. |
| NSPIT Metadata Plugin (QGIS) | A QGIS plugin to create and edit metadata that respects the NSPIT Metadata Standard. |
| NSPIT Metadata Tool (ArcGIS) | An ArcGIS tool to create and edit metadata that respects the NSPIT Metadata Standard. |
Highlighting Conventions
To make reading this document as easy as possible the following conventions were used in the text to highlight different parts of the Platform (Table 2):
Table 2: Highlighting Conventions
| Feature | Convention | Examples | Menus, functions, categories | Italics | Activated Layers Login Transportation and Mining |
|---|---|---|
| Layers, files | Bold, italics | Airports shops.shp kindergardens.geojson |
| Buttons* and links | Bold, within square brackets | [More Information] [Update project] [checkbox] |
*Not every button is a clickable word. The button name therefore often refers to the text that pops up when you move your mouse over the button. In case the button does not have a popup text it is named after the type of button (e.g. checkbox).
Guided Tour
When starting the NSPIT Viewer you have the option to be guided through the NSPIT Viewer step by step by using the Guided Tour.
Note: if the Guided Tour popup does not show up automatically, you most likely confirmed the “Do not show this message again.” message. To display the message again, either delete your cookies and reload the page or navigate to Help and click the reset link.
General overview
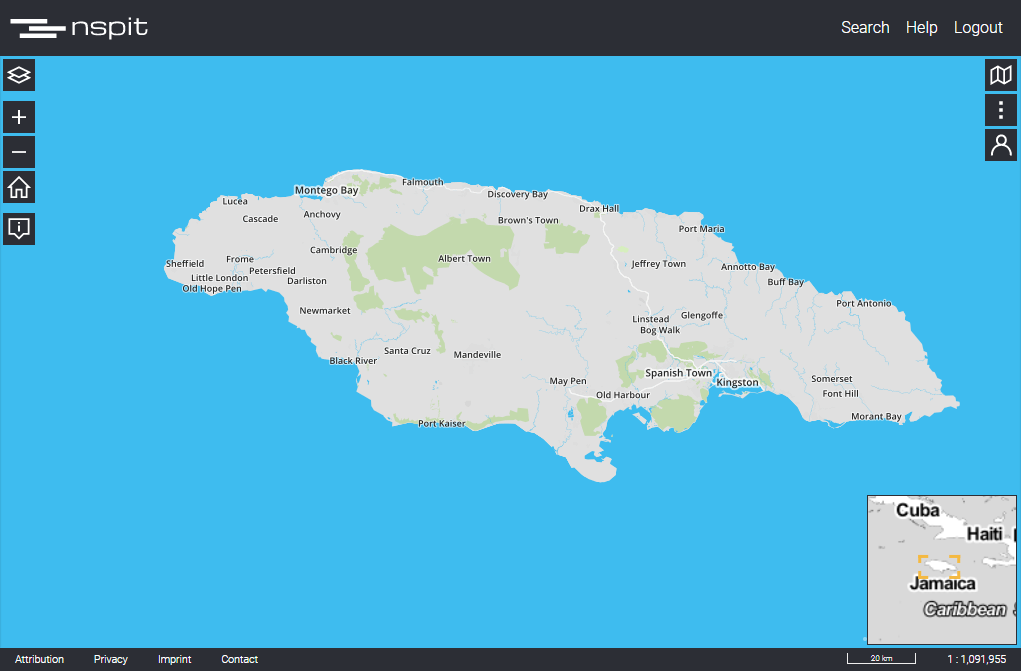
The NSPIT Viewer (Figure 1) contains three parts:
- - a map at the center, and
- - panels on the left and right sides of the screen.
The map is always visible but the side panels can be toggled by clicking a button. In addition to these elements there are buttons that are not part of a panel (map navigation, identification of features, etc.).
Registration, Login & Logout
Registration
Registration is entirely optional, but you can create a NSPIT account to gain access to additional features.
Hint: Registration is completely free.
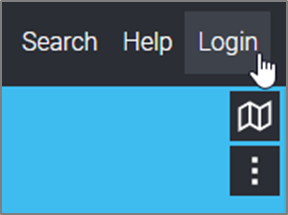
To create an account, click the [Login] button in the upper navigation bar (Figure 2):
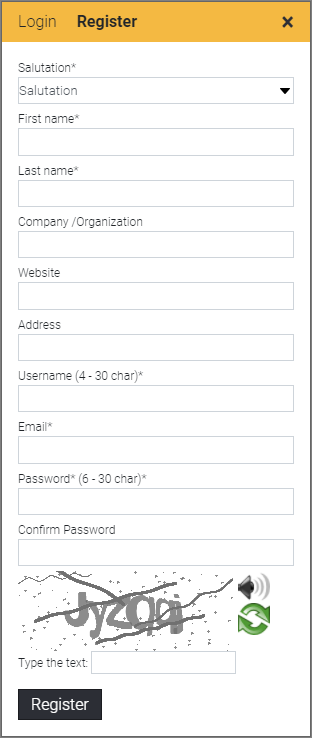
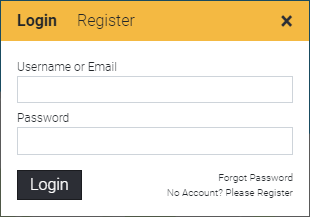
In the following popup activate the [Register] tab and enter the required information (Figure 3). You will be sent an email to confirm the registration.
Benefits of registration
The following features are only available to registered users:
- - Saving and loading projects
- - Exporting projects to a file
- - Changing and saving setting
- - Digitizing features
- - Setting and saving spatial bookmarks
Login
Once you have registered to the Platform you can log in at any time.
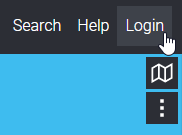
To log in, click the [Login] button (Figure 4) in the upper navigation bar and enter your credentials (Figure 5).
Logout
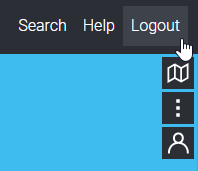
When logged in you can log out by clicking the [Logout] button (Figure 6):
Changing account information
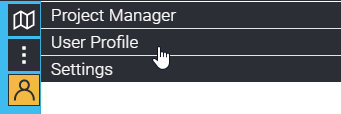
To change the information you entered upon registration, navigate to User Profile (Figure 7).
Web Map
At the center of the NSPIT Viewer is a dynamic web map
Navigation
The NSPIT Viewer’s map offers different ways to move and zoom, as shown in Table 3.
Table 3: Navigation Overview
| Function | Description | |
|---|---|---|
| Move the map | Desktop: Hold down the left click and move the mouse. Mobile: Tap the map and hold the tap while moving your finger. |
|
 |
Zoom in | Desktop: Use the zoom in button or move the mouse wheel forward. Mobile: Tap the map with two fingers and move the fingers away from each other. |
 |
Zoom out | Desktop: Use the zoom out button or move the mouse wheel backward. Mobile: Tap the map with two fingers and move the fingers towards each other. |
 |
Zoom to full extent | Click the full extent button. |
| Zoom to an area | Desktop: Draw a rectangle by holding SHIFT and clicking the map. As long as the click is not released a rectangle is drawn between the clicked location and the mouse’s cursor. The rectangle’s size is adjusted by moving the mouse’s cursor away from (increase) or towards (decrease) the clicked point. Once the mouse button is released the map zooms to the rectangle and the rectangle disappears. Mobile: This function is not supported on mobile as it requires a mouse. |
Changing the basemap
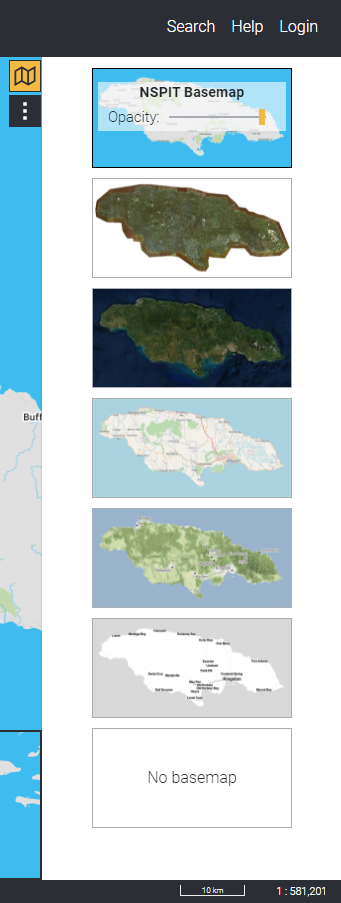
The basemap can be changed by first clicking the [basemaps] button  (right corner of the map under the upper toolbar) and then clicking the basemap to be displayed (Figure 8).
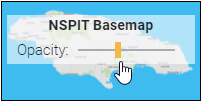
When clicked a slider is displayed. The slider’s handle can be moved to adjust the basemap’s opacity (Figure 9).
The button [No basemap] removes the current basemap and shows a white background.
Activated Layers / Categories
Overview
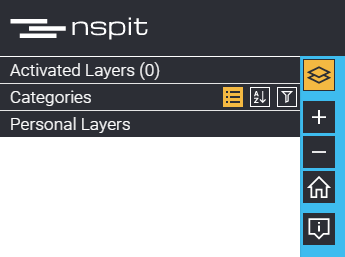
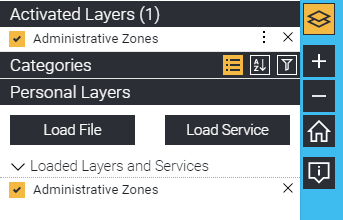
The Table of Contents (TOC) displays all layers that are available in the NSPIT Viewer. You first have to activate a layer to add it to the current map. By default, no layers are activated (Figure 10).
Adding a layer to the map (Activating a layer)
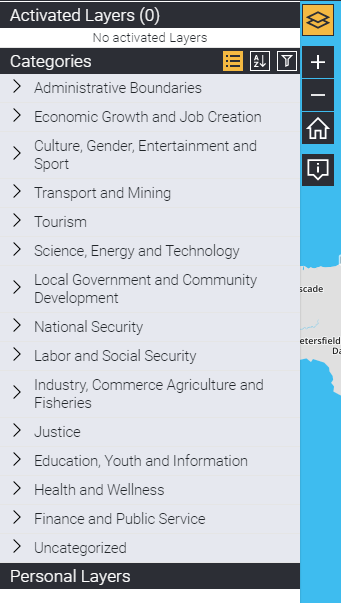
Available layers are shown under Categories (Figure 11). Each layer belongs to a category. If the administrator has not assigned the layer to a category yet, it will show up under Uncategorized.
Hint: Instead of choosing layers from the Categories menu you can also list all available layers alphabetically or search for a layer by name.
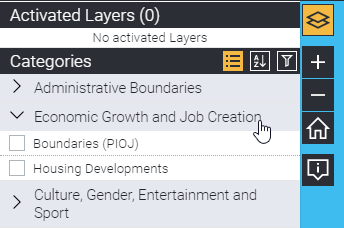
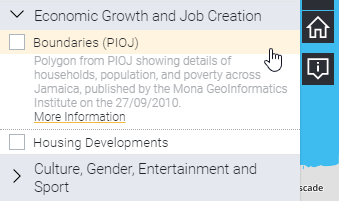
To see available layers, first expand a category by clicking its name (Figure 12):
You can then click the layer’s name to see additional information (Figure 13):
Hint: Clicking [More Information] opens the NSPIT Metadata Portal and shows the layer’s metadata. Click the [checkbox] (Figure 14) to add the layer to the map. The layer will then also be shown under Activated Layers:
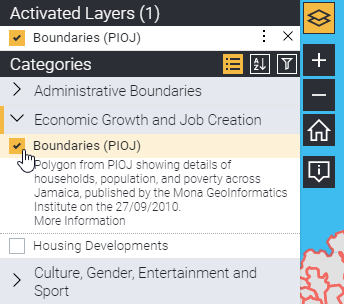
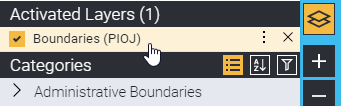
Under Activated Layers, click the layer name (Figure 15) to see more options (Figure 16).
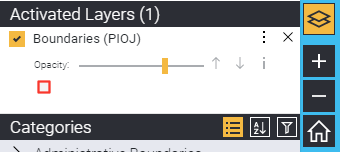
Changing a layer's opacity / transparency
Click the slider to move the handle to the clicked position. When moved to the right the layer becomes opaquer (less transparent), when moved to the left the layer becomes less opaque (more transparent).
Showing more information
Click the [Info] button  to show the layer’s metadata abstract. To see the full metadata available for the layer, click on the [More Information] link. This opens the NSPIT Metadata Portal and shows the layer’s metadata.
Changing the layer order
Once more than one layer has been activated, the order of the displayed layers can be changed. This is especially helpful when layers overlap and you would like to change the rendering order.
Click on the layer’s name to see upward and downward pointing arrows.
The upward pointing arrow moves the layer on level upwards and the downward arrow moves the layer on level downwards. The higher the layer in the Table of Contents (TOC) the higher the layer in the map (i.e. the topmost layer in the TOC will be rendered on top of all other layers in the map).
Removing a layer from display
A layer can be removed from display or it can be removed entirely from Activated Layers. To remove a layer from being displayed in the map click the [checkbox] next to the layer name to remove the checkmark. To remove a layer entirely from the activated layers, click the X button. Removing a layer from Activated Layers also removes it from the map.
Personal Layers
In addition to NSPIT services that are already included in the NSPIT Viewer you can add your own data. The data can be file-based or it can be added as a web service.
Note: Personal files are uploaded to your browser to be displayed in addition to predefined NSPIT layers. These files are temporary and will disappear once the browser is closed. They:
- - are not saved in your user profile
- - are not saved in the NSPIT Platform’s central database
- - will not be visible to other users
Note: If you are an employee of a government agency who would like to share data to be included in the NSPIT Viewer, please contact the National Spatial Data Management Branch (NSDMB).
Adding vector data
To add file-based vector data expand Personal Layers and then click the button [Load Layer] and select the file type you would like to add to the viewer. You are then presented with an interface to navigate to a dataset on disk.
You can add data of the following types: GeoJSON, KML, GPX, shapefile, WKT.
Note: shapefiles must be added as a zip file which must include .shp, .dbf and .shx files. Allowed coordinate systems: EPSG:4326, EPSG:3857, EPSG:2448
Adding a web service
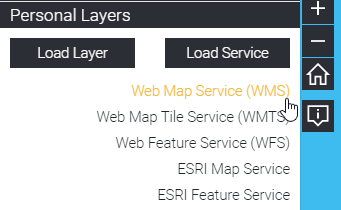
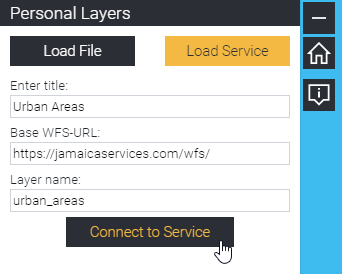
To add a web service, expand Personal Layers and then click [Load Service] and select the service type you would like to add to the viewer (Figure 17). You are then prompted to add a URL to the service.
You can add services of the following types: Web Map Service (WMS), Web Map Tile Service (WMTS), Web Feature Service (WFS), Esri Map Service, Esri Feature Service.
Note: For WMS and WMTS services you must first load the base URL. The NSPIT Viewer then requests the service’s capabilities and detects available layers.
WFS and Esri services layers are not automatically detected. You must provide the layer name along with the base URL.
Example: requesting a WMS/WMTS
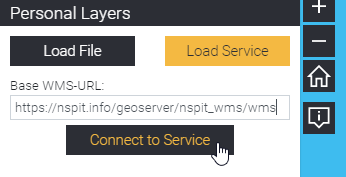
Step 1: Add a base URL and load it by clicking the button [Connect to Service] (Figure 18).
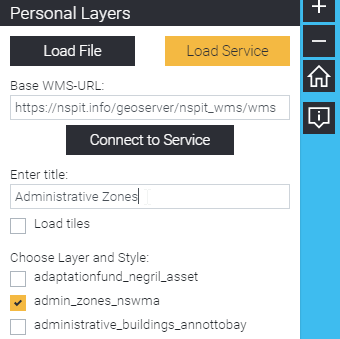
Step 2: Select a layer by checking the [checkbox] next to the layer’s name and enter a title (the title will appear under Activated Layers) (Figure 19).
Step 3: Load the service by clicking the button
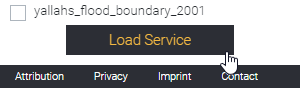
The service will then be added to the Activated Layers panel under the name you provided. Additionally, it will be shown under Personal Layers (Figure 21).
Hint: In Step 2 you can select multiple layers from the service. They will be grouped and show up as one layer in the NSPIT Viewer.
Example: requesting a WFS/Esri service
Tools
The [Tools] button  can be clicked to show the tools side panel (Figure 23).
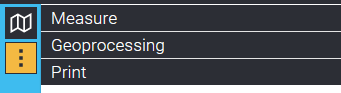
By default, only the Measure and Print tools are displayed. More tools are available to users who have created an NSPIT account.
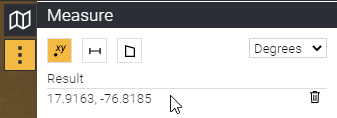
Measure tool
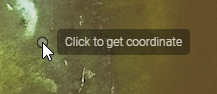
a) Coordinates (degrees, DMS, JAD2001)
Click the [Get coordinate] button  and then click on the map (Figure 24). The click’s coordinate is displayed in the result window (Figure 25) in degrees, DMS (degrees, minutes, seconds) or JAD2001.
b) Lengths (meters, kilometers, miles)
Click the [Measure line] button  and draw a line.
Start drawing by left-clicking on the map. Move the mouse and click the map again to set a new vertex. The total length is shown next to the cursor and in the result window. Double click the map to finish the line sketch.
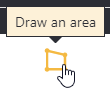
c) Areas (square meters, square kilometers, acres, hectares)
Click the [Measure area] button  and draw an area.
Start drawing by left-clicking on the map. Move the mouse and click the map again to set a new vertex. The total area is shown in the center and in the result window. Double click the map to finish the area sketch.
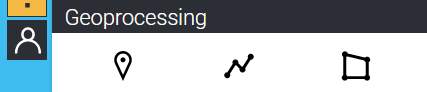
Creating buffers (Geoprocessing tool)
To generate a buffer, navigate to the Geoprocessing menu.
Creating a buffer
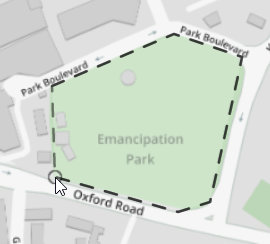
First, you must draw a shape that will be buffered.
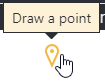
You can draw a point, a line or a polygon (Figure 26):

Drawing a shape works exactly like in the Draw and Measure tools (Figure 27):
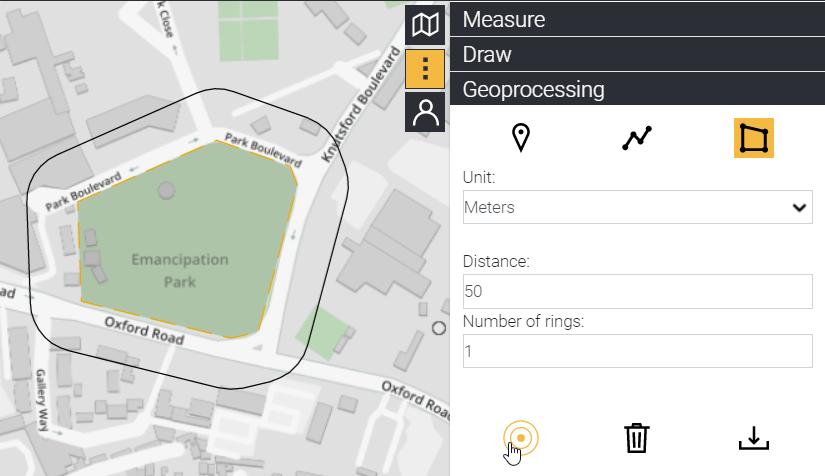
Once the drawing sketch is completed, pick a unit, enter a distance and click the [Create Buffer] button. The buffer is then generated and added to the map (Figure 28).
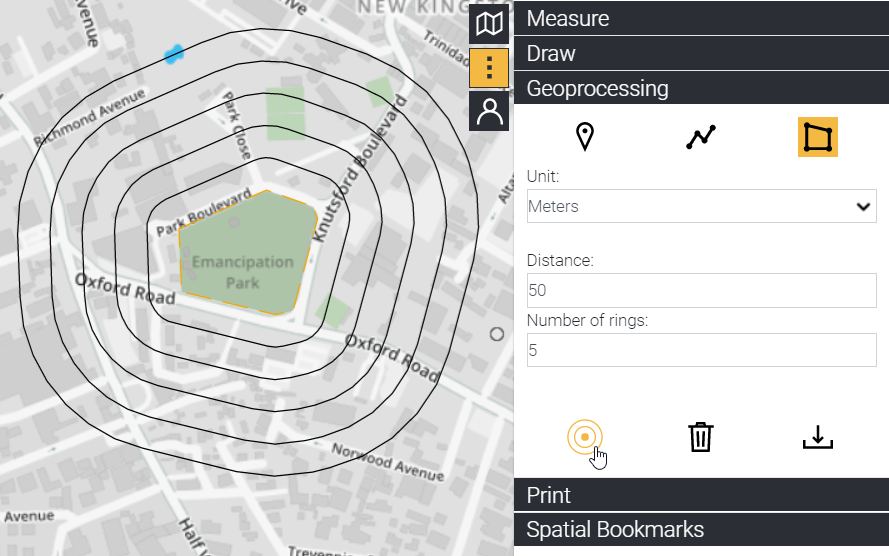
Creating multi-ring buffers
By default a simple buffer is created but you can increase the number of rings to create a multi-ring buffer.
In the following example a new ring is created every 50 meters, with 5 rings total (Figure 29):
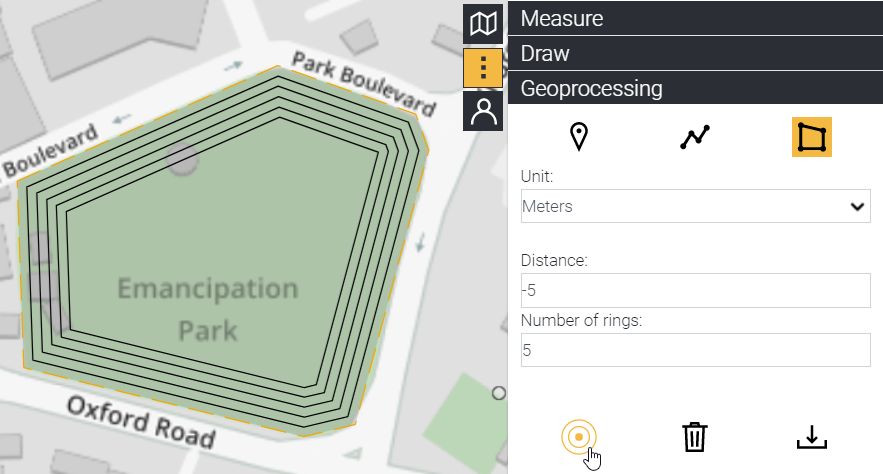
Creating negative buffers
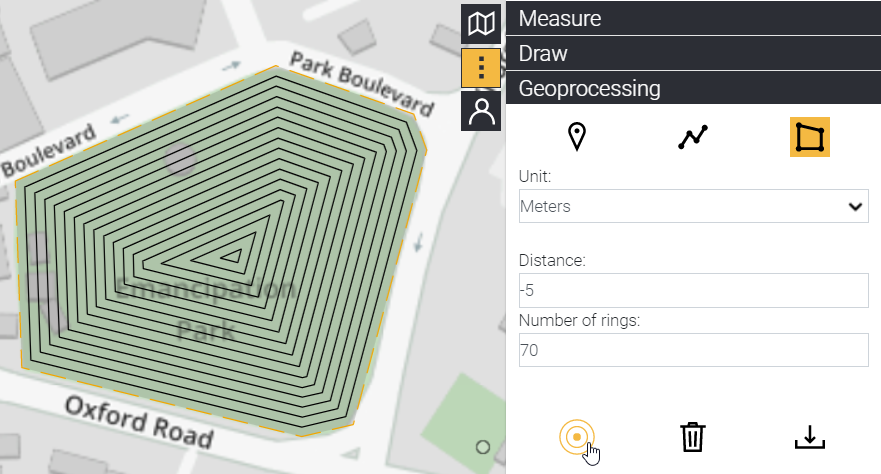
For polygons you can enter a negative distance. This will create a buffer within the shape’s boundaries (Figure 30):
The tool is smart and rejects unrealistic values. For example, if you enter too many inside-rings, the tool will calculate as many as are possible and then stop. In the following case the tool will not render 70 rings (Figure 31):
Downloading a buffer
 Buffers can be downloaded as a GeoJSON file by clicking the [Download buffer] button.
Print tool
The print tool is used to generate a map in PDF format.
Click the print header and then the [Activate Print] button.
A gray rectangle is subsequently shown on the map. Anything within the gray rectangle will be part of the final map (Figure 32).
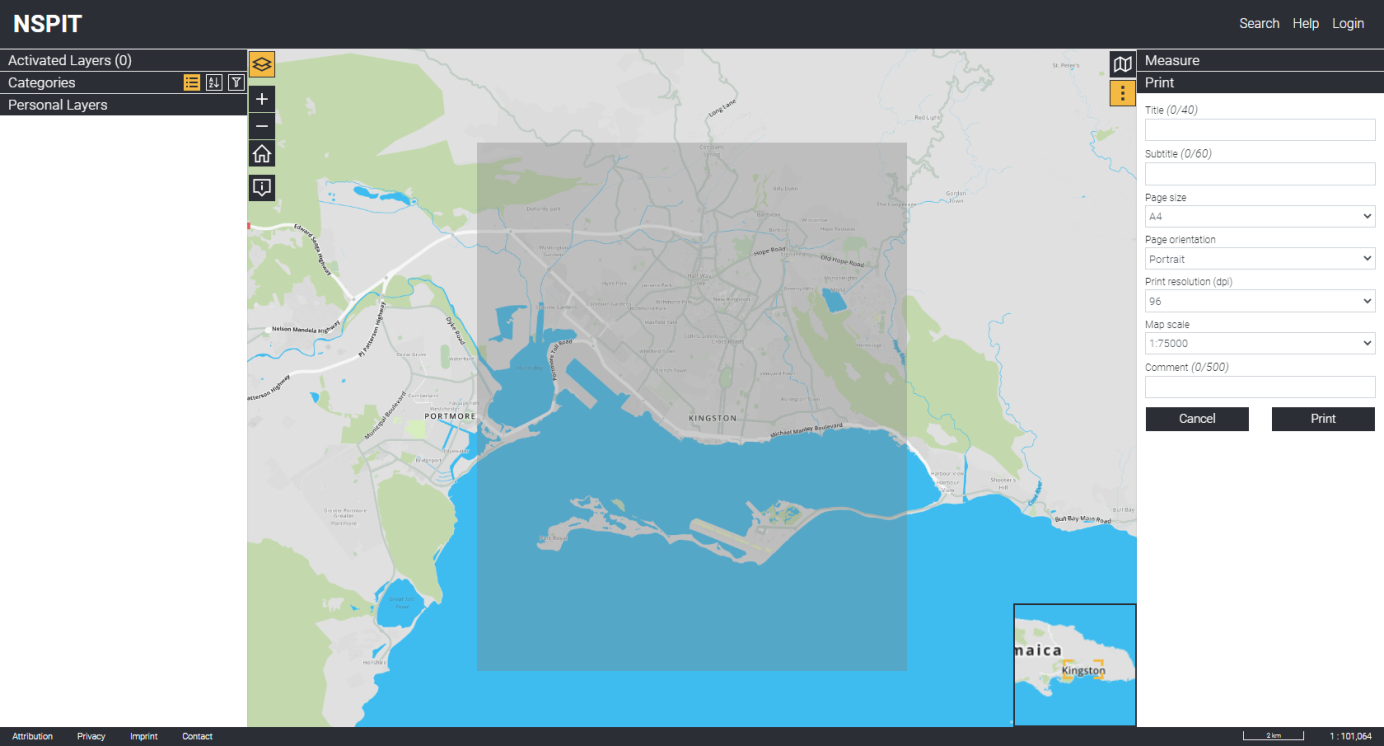
Move the map or zoom in or out to make sure everything you would like to print is within the rectangle. You can choose from predefined values to change the page size, the orientation (portrait or landscape), the resolution or the scale. Additionally, you can enter text to add a title, subtitle and a comment.
Spatial Bookmarks (Login Required)
Note: You must log in to use this feature.
A spatial bookmark lets you save a given extent so you can zoom to it after.
Activate the Spatial Bookmarks tool by clicking the header.
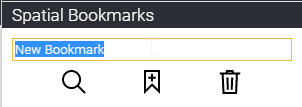
Click the [Add new bookmark] button ![]() . The current extent and zoom level is then saved as a bookmark in your profile.
. The current extent and zoom level is then saved as a bookmark in your profile.
When creating a new bookmark you can optionally enter a name for the bookmark (Figure 33).
You change the name at any moment by double clicking the bookmark’s name.
To zoom to a bookmark, first click the [checkbox] next to its name and then click the [Load bookmark] button (Figure 34).
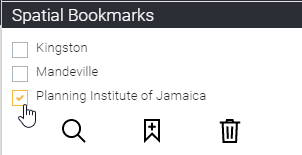
To delete a bookmark, first click the [checkbox] next to its name and then click the [Delete bookmark] button (Figure 35).

Note that bookmarks are stored in your user profile and therefore are available across projects; you do not need to create the same bookmarks in multiple projects.
Drawing (Login Required)
Note: You must log in to use this feature.
You can use the NSPIT Viewer to draw new features. The following drawing types are available:
- - Point
- - Line
- - Polygon
- - Text
Creating a new drawing layer
To create a new drawing layer, click one of the following buttons (Figure 36):
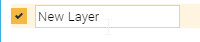
When clicked a new layer is created and saved in your project. The new layers is named New Layer, but you can rename it by double clicking it.
When double-clicked the text becomes editable (Figure 37):

Drawing Features
You can add the following to the map:
- - Points
- - Lines
- - Areas
- - Text
Each layer can save all of these four types. Unlike in typical GIS software there is no need to create separate layers for separate geometries!
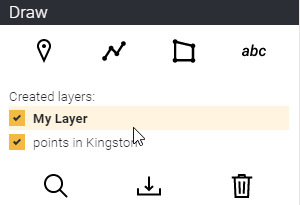
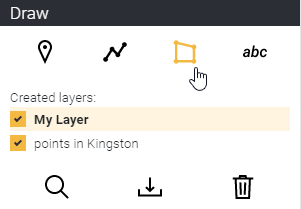
a) To add a feature to a layer, first highlight the layer by clicking its name. When clicked the layer is shown in bold and is highlighted in gold (Figure 38):
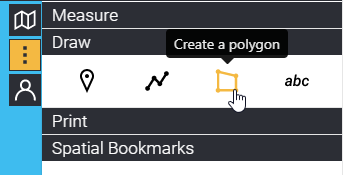
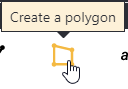
b) Next, click one of the drawing icons, such as the [Create a polygon] (Figure 39):
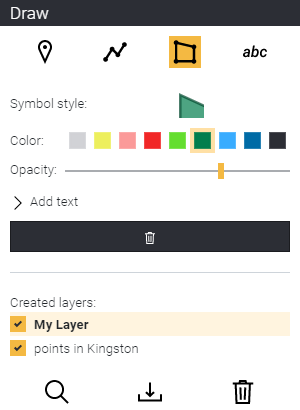
c) Once the icon is clicked you will be able to adjust its appearance (color, and opacity) (Figure 40):
d) Then you can start drawing.
Renaming a layer
To rename a layer, double click it. When double-clicked the text becomes editable (Figure 41):
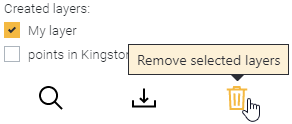
Deleting a layer
To delete a layer, first click the [checkbox] next to its name and then click the [Remove selected layers] button (Figure 42):
You will be prompted to confirm whether you truly want to delete the layer (Figure 43, Table 4):
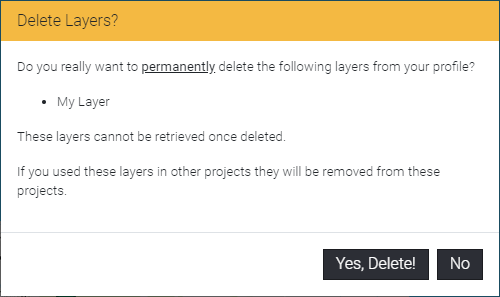
Table 4: Delete Layers Options
| Option | Description |
|---|---|
| [Yes, Delete!] | Removes the layer from display and permanently deletes it from your account. |
| [No] | Closes the menu without removing or deleting the layer. |
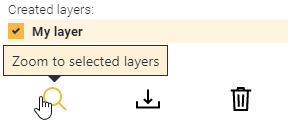
Zooming to a layer
To zoom to a layer, click the [checkbox] next to its name and click the [Zoom to selected layers] button (Figure 44):
Downloading a layer as a GeoJSON file (.geojson)
To download a layer, click the [checkbox] next to its name and click the [Export selected layers] button (Figure 45):
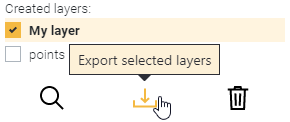
This will create a GeoJSON feature collection and write it to a .geojson file.
More information about the GeoJSON format
GeoJSON is an open standard and the most commonly used vector format in web mapping. However, it is not only used in web mapping. It is also widely supported in desktop GIS. Simply drag and drop a GeoJSON file to QGIS or ArcGIS and you will see that loading it is no problem!
GeoJSON is text-based, meaning that you can open it in any text editor. Unlike other formats, such as shapefiles, you do not need special GIS software to read it.
Why GeoJSON was chosen as the main format in the NSPIT Platform:
- - It is the main web mapping format (in other words: GeoJSON is for web mapping what to many the shapefile is in desktop GIS
- - Every browser can read it (no plugins are required)
- - Every browser can write it (no plugins or server-side components are required)
- - It can be read by major GIS software (QGIS, ArcGIS)
- - It can be converted to any other vector format
To find out more about the GeoJSON format’s inner structure, have a look at the official specification: https://geojson.org
Project Manager (Login Required)
Note: You must log in to use this feature.
You can save projects to save a specific state of the viewer. This includes the map’s extent, zoom level, settings and activated layers. Projects are saved in your user profile.
Creating (saving) a new project
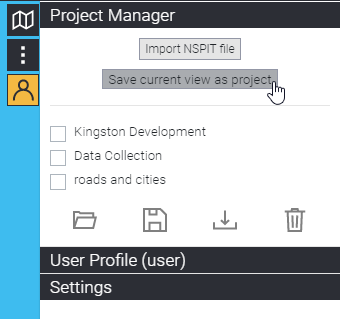
Navigate to the Project Manager and click [Save current view as project] (Figure 46).
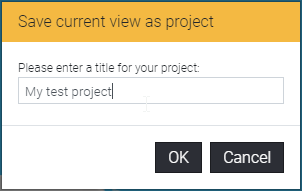
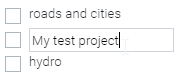
A popup is displayed that asks you to enter a name. Note that a name must be entered for a project to be saved (Figure 47).
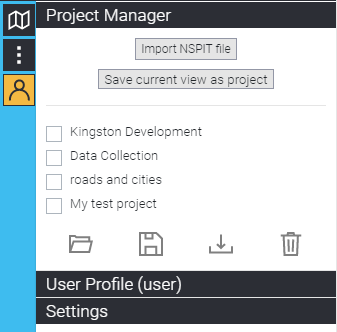
The project then shows up in the Project Manager (Figure 48):
Saving an existing project
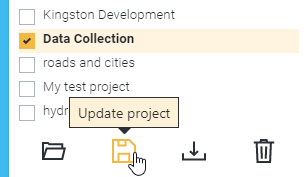
To save a project that already exists, first click the [checkbox] next to the project’s name in the Project Manager and then click the [Update project] button (Figure 49):
Renaming a project
To rename a project, double click its name and adjust the text (Figure 50).
Opening a project
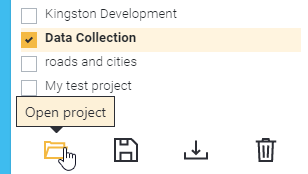
To open a project, click the [checkbox] next to its name and click the [Open project] button (Figure 51):
Deleting a project
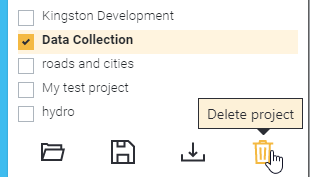
To delete a project, click the [checkbox] next to its name and click the [Delete project] button (Figure 52):
Exporting a project (.nspit file)
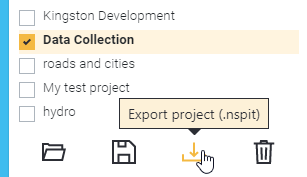
To download a project, click the [checkbox] next to its name and click the [Export project (.nspit)] button (Figure 53):
NSPIT projects are saved as .nspit files. The .nspit format is text-based and human readable. .nspit files include the following information in JSON format:
- - Date and time the file was generated
- - Project name
- - Map center
- - Map zoom level
- - Activated tools
- - Activated basemap
- - Activated overlays
Importing a project
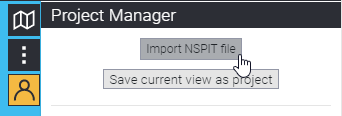
.nspit files can be imported using the [Import NSPIT file] button (Figure 54).
Activating and deactivating tools (Login Required)
Note: You must log in to use this feature.
Expand the Settings menu to add or remove various tools and navigation controls from display. Toggle the [checkbox] next to a tool’s name to add or remove a control.
Hint: The settings are not automatically saved, but when you save a project the current settings are saved in that project. Therefore, you can have different settings in different projects.
Requesting a feature's attributes
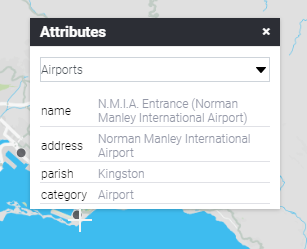
To request the attributes of a layer’s feature you first activate the [Identify] tool  and then click on the feature. The attributes are then presented in a popup (Figure 55):
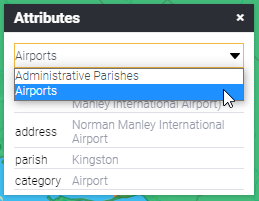
Note that the clicked layer name is presented in a dropdown. In some cases, features from multiple layers overlap. If this happens you can switch to the correct layer in the dropdown (Figure 56):
Searching addresses, places
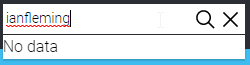
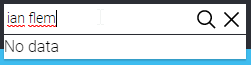
Activate the search input field by clicking Search in the upper navigation bar. Type in a search word and then click the [Search] button (magnifying glass). You will then be provided with search results. You can click a result to zoom to it on the map (Figure 57).
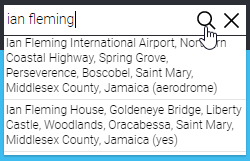
Hint: Remember to refine your queries and to watch out for typos or missing spaces. Sometimes queries that are minimally different might not return any results (Figures 58, 59):
Summary
This concludes the NSPIT Viewer Manual. You should now be familiar with:
- - creating an account and logging in
- - navigating and changing basemaps
- - finding a place
- - activating layers (loading NSPIT data)
- - exploring attributes of NSPIT layers
- - loading personal data (files, services)
- - creating, renaming, deleting, drawing, downloading shapes
- - creating, renaming, saving, deleting, downloading projects
- - creating, renaming, deleting and zooming to bookmarks
- - measuring points, lines, areas
- - creating and downloading buffer, including a multiple ring buffer
- - exporting a map to a PDF